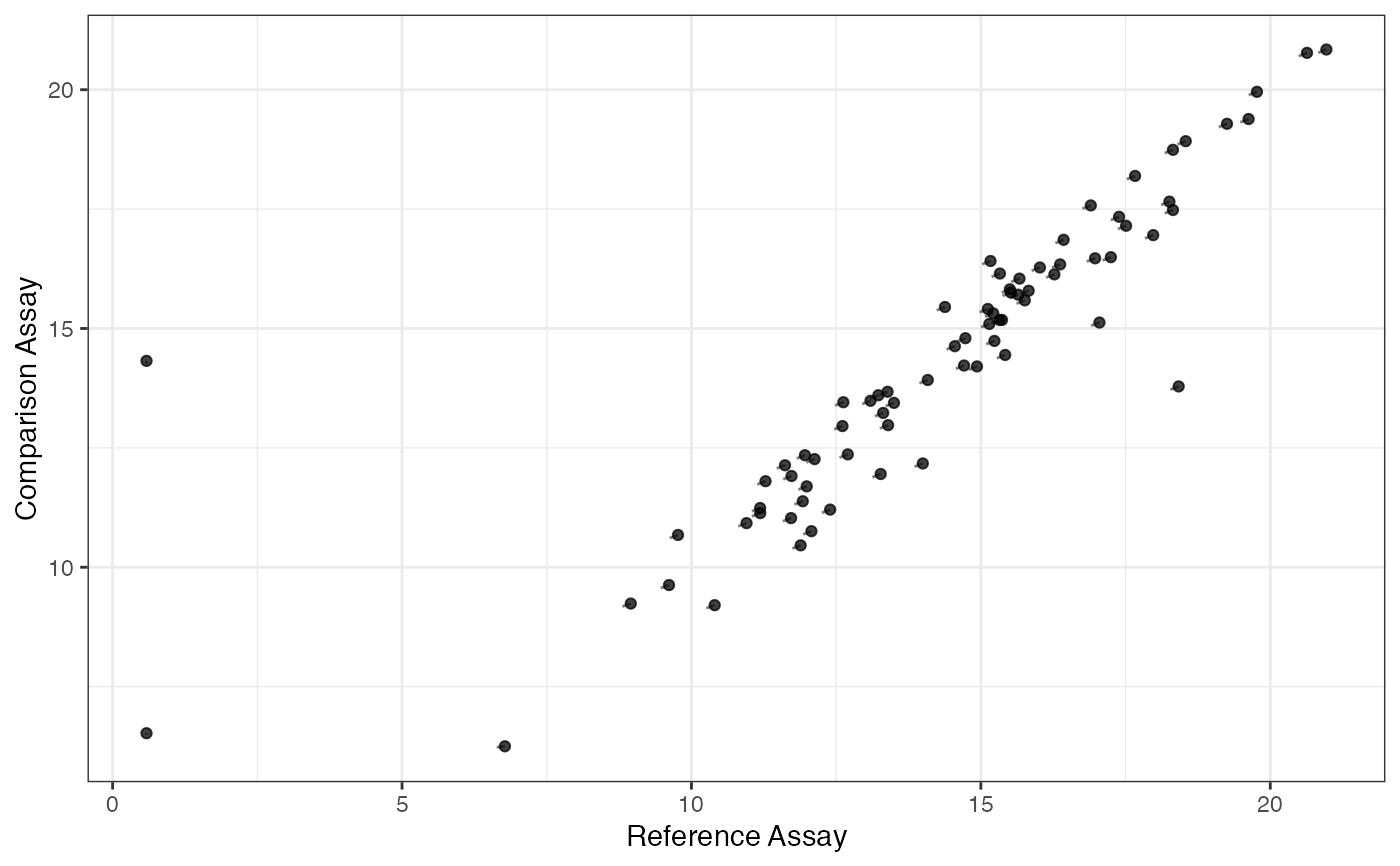
Plot the average expression value of two subsets of the data.
Generally these might be 1 cell and multiple-cell replicates,
in which case if the mcols column ncells is
set then the averages will be adjusted accordingly.
But it could be any grouping.
plotSCAConcordance(
  SCellAssay,
  NCellAssay,
  filterCriteria = list(nOutlier = 2, sigmaContinuous = 9, sigmaProportion = 9),
  groups = NULL,
  ...
)
Arguments
- SCellAssay
is a FluidigmAssay for the 1-cell per well assay
- NCellAssay
is a FluidigmAssay for the n-cell per well assay
- filterCriteria
is a list of filtering criteria to apply to the SCellAssay and NCellAssay
- groups
is a character vector naming the group within which to perform filtering. NULL by default.
- ...
passed to
getConcordance
Value
printed plot
See also
getConcordance
Examples
data(vbetaFA)
sca1 <- subset(vbetaFA, ncells==1)
sca100 <- subset(vbetaFA, ncells==100)
plotSCAConcordance(sca1, sca100)
#> Using primerid as id variables
#> Using primerid as id variables
#> Using primerid as id variables
#> Using primerid as id variables
#> Sum of Squares before Filtering: 14.89
#>  After filtering: 14.01
#>  Difference: 0.87